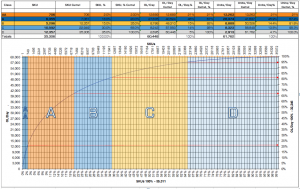
In previous blogs , I have reviewed the Pareto Principle, or the 80-20 Rule, and of the trap of a single-technology system for the entire SKU base. I have also talked about fast-moving SKUs and how to deal with them from a technology standpoint.
In this post, I want to go to the opposite end of the Pareto curve to the C- & D-movers. I like to refer to these as the Museum Pieces because they often sit in your distribution center and generate no business. If you walk through your distribution center they are usually easy to identify; they’re the ones covered in dust.
MUSEUM PIECES
I went through a liquor distribution center last year where they slotted SKUs by product velocity. As I passed through the carton flow racks – the A-, or fast-movers, I saw some SKUs that had been there a long time. These were obviously SKUs that were once slotted as fast-movers, but had long since died in demand. Lesson learned: the Museum Pieces can show up anywhere, and you have to be aggressive in identifying them and moving them to the appropriate pick zone. This is where technology really helps – by automatically identifying and re-slotting these SKUs.
Now let’s look at the Pareto curve. Obviously, the Museum pieces lie to the right end. But how far to the left can we go before we are including SKUs that move too fast? The answer lies in the technology we will use for selecting these items.
P2P TECHNOLOGIES
There are a lot of technologies out there that serve this area of the Pareto Curve, all based upon the product-to-person ideology. Rather than sending a selector to the warehouse to identify and select an item, these systems use technology to bring the product to the selector. We call this product-to-person, P2P or goods to man .
Many companies claim that they can generate 1000 order-lines per hour and while it is true that many of these systems can deliver 1000 totes of product to a work station for picking, it is not true that a human being can sustain this pick rate over an eight-hour shift. A good planning rate for these systems is 650-700 lines per hour. Note, however, that this rate is double the effective rate of pick-to-light or pick-to-voice.
DESIGNING WITH P2P
Armed, now, with a pick rate of 700 OL/hr, let’s consider the Pareto curve above. The curve above shows order-lines (OL) per day on the Y axis, and SKUs (in percentage and numbers along the X axis. So if we had a system that would generate 700 OL/hr for a single shift, it would do 5,600 OL per shift or 5,250 if we include two 15 minute breaks.
If we used two systems instead of just one, we could handle 10,440 OL/shift. Now if we consider the Pareto curve, we can see that the operation requires we do about 60,000 OL/day. Beginning from the top of the Y axis, we subtract 10,440 OL/day, and we arrive at 49,560 OL/day, or roughly 50,000 OL. Look where this point falls on the Pareto Curve; right at the boundary of the B- and C-movers. So with two systems, you can handle all of the C- and D-movers with two full-time employees who will generate about 10,440 OL/day.
Alternatively, you could have a single system that would manage this volume over two shifts instead of one. You still need two FTEs to process the work, but only need to spend half the capital to do the job. This is the benefit of product-to-person systems. This system manages 65% of your SKUs, 20% of your order-lines with only two people.
These systems are extremely effective for managing your Museum Pieces.
CUBIC VELOCITY
One more concept we need to consider in applying these systems is cubic velocity. Let’s consider for a moment two common items; coffee cups and No. 2 pencils. Both of these items move at 24 OL/day, and both have an average of 1 piece/OL. That means on an average day, we will move a tote 24 times to the pick station and each time we will pick 1 coffee cup, or 1 pencil.
Now, if I can only fit 24 coffee cups into a tote, it is plain to see that at the end of the day, I will have exhausted the supply in the tote, whereas in the pencil tote, I would hardly notice 24 pencils missing. Clearly, cubic velocity has both replenishment and storage implications. I will have to replenish the coffee cups much more frequently than the pencils that will create movements in my system.
This creates what I affectionately call “thrash” in the system. These products are better placed in a flow-rack channel or a pick location where I can replenish multiple cases at once.
This leads us to the second point – storage. Yes, you could have multiple totes of the same product in the P2P technology, but the cost of the multiple locations in this technology argues against it. Again, a simpler storage location where more of the same product is stored might be more effective.
Coffee cups would work well in a flow rack location, where pencils would be ideal in the P2P system. In selecting SKUs for the P2P technology, then, the product velocity AND cubic velocity must be considered.
Later we will focus on what to do with all that remains – the leftovers. I would be interested to hear some examples of how your company concentrated your slow-movers and dealt with the Museum Pieces. Do you have a clever use of technology to solve this problem? Let us know by commenting below!


