• Home
  • About Us
    • Quick Info
    • Customers
  • Philosophy
    • We do the Math
    • Product to Person
    • The Pareto Principle
  • Services
    • Automated Distribution Center
    • Material Handling Design
    • Pallet Shuttle Systems
    • ROI AGV Fork It
    • System Integration
    • Consulting and Studies
    • AGC
    • WCS
      • The Conductor
    • GOH Storage
  • Newsletter
  • Contact
  • Solutions
    • abco AUTOMATION’s Process
    • Analysis of Your DC
    • Concepting
    • Client Presentation
    • Design and Layout
    • ROI Analysis
    • Completed Concept
  • Downloads
  • Blog
  • Video

The Pareto Curve and How it Affects Distribution Center Design

by Travis Baker

The reason that a lot of distribution center design isn’t efficient or even fails completely can be summed up in one sentence.distribution center design

If all you have is a hammer everything looks like a nail

Do you have a single-technology distribution center? Do you pick all your SKUs using the same method? If you do have a single technology distribution center you may be missing some huge opportunities for efficiency.  Let’s explore why that is; and that means going to Italy.

The Italian economist Vilfredo Pareto first observed that 80% of the land in Italy was owned by 20% of the population. He also was able to apply it to the income in his country. Most of the money was controlled by a relatively small percent of the population.

Years later, business-management thinker, Joseph M. Juran, developed the 80/20 principle and named it after Pareto.

And this rings true across a great swath of the world: 20% of your customers account for 80% of your sales, 80% of your HR problems come from 20% of your workforce, etc.  This also hold true in our world of distribution. In fact, there is a great deal of similarity between peas and your distribution center.

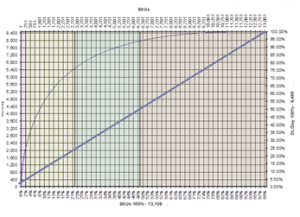
The 80/20 rule states that 20% of your SKU-base does 80% of your volume. That’s right: 80% of your volume is done by 20% of your SKUs.  And conversely 80% of your SKUs do only 20% of your volume.

Only 20% of your SKUs make up 80% of your volume!

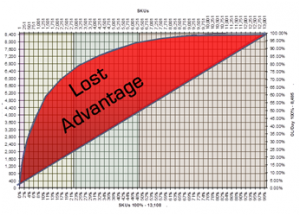
Ok great, so what does that have to do with your distribution center design? Well if you’re picking all of your SKUs the same way, then you are missing out on huge opportunities.

If you have a single-technology picking system you are assuming that every SKU that you add moves at the same rate as the last one you added. So you have a linear function on this curve, as demonstrated by the arrow to the right.

So proceeding with that thought as you add from 25% to 50% of your SKU base, you add from 25 to 50% more business volume.

You are assuming in your one-technology system that everything moves through the distribution center as the same rate.

But Pareto says 20% of my SKU base does 80% of my business volume. And it doesn’t really matter whether I measure my business volume in lines or pieces, however you want to metric your business volume, it really doesn’t matter…


Want to read the rest of the whitepaper?  Download it here in less than 60 seconds!


Share this:

  • Email
  • Print
  • Tweet

Like this:

Like Loading...
Filed Under: distribution center design, Pareto Principle, S.A.L.T. Principle Tagged With: 80-20 Rule, distribution center design

Why Smart Distribution Center Design Doesn’t Use a Single-Technology Solution

by Travis Baker

Hi I am Cory Flemings from abco automation. Do you have a single technology distribution center? Do you basically pick all your SKUs the same way? If that’s the case you may be missing some huge opportunities for efficiency and I would like to show you why.

In the 19th century there was an Italian guy named Vilfredo Pareto. And he is responsible for the Pareto Curve or the Pareto Principle. We know it today as the 80/20 rule, as we have applied it to business.

The 80/20 rule basically states that 20% of your SKU base does 80% of your volume. That’s right 80% of your volume is done by 20% of your SKU’s.  And conversely 80% of your SKU’s do only 20% of your volume.

So what does that have to do with your distribution center design? Well if you’re picking all of your SKU’s the same way then you are forgetting this principle. You are assuming that every SKU that you add moves the same way as the last one you added. So you have a linear function on this curve. Well, kind of linear.

So as I add from 25 to 50% I am adding from 25 to 50% of my business volume. Whether I measure my business volume in lines, in pieces, in red ramzonics, however you want to metric your business volume it really doesn’t matter. You are assuming in a one technology system that everything gets picked the same. But Pareto says this, Pareto says 20% of my SKU base, does 80% of my business volume. And it looks like this.

You’ll notice that we wear really groovy shirts at abco automation that have the Pareto Curve built right into them. And that’s because we think you can really leverage the difference between this linear relationship in this Pareto curve. This Pareto curve, again, suggest that 20% of your products do 80% of your volume.

Why then would I take those SKU’s the same way that I take these SKU’s down near the end which I will say are my “D” SKUs, if I put letters on them. Or my ‘Dog” SKUs. These SKUs down at the end they might only do 4% of your business volume and with the “C’s” together somewhere between 10 to 15% of my whole business volume. Yet they are going to represent 50% of your SKU base.

And if you are a distribution center operations person you’re slapping your forehead saying “Why do we even bother carrying these things will well it doesn’t matter what products you carry, you will always have this Pareto effect.

So why’d you pick them all the same way?

These products that are down here at the end can have some technology applied to them these two things here in products that I call products-to-person technologies. They might be carousel systems or shuttles but they are technologies or vehicles that bring products to the picker.  Instead of the picker going out and passing 80% of the SKUs in the warehouse to find the one that they need. These products or technologies bring them to the selector instead. (A distribution center design can realize) a huge benefit in the efficiency of picking these orders here.

Over here on the other end you have 20% of your products that are doing 80% of your volume. Why would you move these products around? These products need to be stationary or stay in one area and they can be picked. Often times the problem you are dealing with here is how is do you replenish them fast enough.

In both cases automation can be used to help select these and select these, differently.  Do you have, as I asked earlier, a single technology warehouse? Well then you can see now there are some huge differences in efficiency that we can apply to help make your distribution center design more efficient.

Give us a call at abco automation 803-517-7537 we can help do the analysis and carve your Pareto curve up with the proper technologies. Because we do the math.

Share this:

  • Email
  • Print
  • Tweet

Like this:

Like Loading...
Filed Under: distribution center design, Pareto Principle, video Tagged With: 80-20 Rule

How to Use Automated Distribution for “Museum Pieces”

by Cory Flemings

In previous blogs , I have reviewed the Pareto Principle, or the 80-20 Rule, and of the trap of a single-technology system for the entire SKU base. I have also talked about fast-moving SKUs and how to deal with them from a technology standpoint.

In this post, I want to go to the opposite end of the Pareto curve to the C- & D-movers. I like to refer to these as the Museum Pieces because they often sit in your distribution center and generate no business. If you walk through your distribution center they are usually easy to identify; they’re the ones covered in dust.

MUSEUM PIECES

I went through a liquor distribution center last year where they slotted SKUs by product velocity. As I passed through the carton flow racks – the A-, or fast-movers, I saw some SKUs that had been there a long time. These were obviously SKUs that were once slotted as fast-movers, but had long since died in demand. Lesson learned: the Museum Pieces can show up anywhere, and you have to be aggressive in identifying them and moving them to the appropriate pick zone. This is where technology really helps – by automatically identifying and re-slotting these SKUs.

Now let’s look at the Pareto curve. Obviously, the Museum pieces lie to the right end. But how far to the left can we go before we are including SKUs that move too fast? The answer lies in the technology we will use for selecting these items.

P2P TECHNOLOGIES

There are a lot of technologies out there that serve this area of the Pareto Curve, all based upon the product-to-person ideology. Rather than sending a selector to the warehouse to identify and select an item, these systems use technology to bring the product to the selector. We call this product-to-person, P2P or goods to man .

Many companies claim that they can generate 1000 order-lines per hour and while it is true that many of these systems can deliver 1000 totes of product to a work station for picking, it is not true that a human being can sustain this pick rate over an eight-hour shift. A good planning rate for these systems is 650-700 lines per hour. Note, however, that this rate is double the effective rate of pick-to-light or pick-to-voice.

DESIGNING WITH P2P

Armed, now, with a pick rate of 700 OL/hr, let’s consider the Pareto curve above. The curve above shows order-lines (OL) per day on the Y axis, and SKUs (in percentage and numbers along the X axis. So if we had a system that would generate 700 OL/hr for a single shift, it would do 5,600 OL per shift or 5,250 if we include two 15 minute breaks.

If we used two systems instead of just one, we could handle 10,440 OL/shift. Now if we consider the Pareto curve, we can see that the operation requires we do about 60,000 OL/day. Beginning from the top of the Y axis, we subtract 10,440 OL/day, and we arrive at 49,560 OL/day, or roughly 50,000 OL. Look where this point falls on the Pareto Curve; right at the boundary of the B- and C-movers. So with two systems, you can handle all of the C- and D-movers with two full-time employees who will generate about 10,440 OL/day.

Alternatively, you could have a single system that would manage this volume over two shifts instead of one. You still need two FTEs to process the work, but only need to spend half the capital to do the job. This is the benefit of product-to-person systems. This system manages 65% of your SKUs, 20% of your order-lines with only two people.

These systems are extremely effective for managing your Museum Pieces.

CUBIC VELOCITY

One more concept we need to consider in applying these systems is cubic velocity. Let’s consider for a moment two common items; coffee cups and No. 2 pencils. Both of these items move at 24 OL/day, and both have an average of 1 piece/OL. That means on an average day, we will move a tote 24 times to the pick station and each time we will pick 1 coffee cup, or 1 pencil.

Now, if I can only fit 24 coffee cups into a tote, it is plain to see that at the end of the day, I will have exhausted the supply in the tote, whereas in the pencil tote, I would hardly notice 24 pencils missing. Clearly, cubic velocity has both replenishment and storage implications. I will have to replenish the coffee cups much more frequently than the pencils that will create movements in my system.

This creates what I affectionately call “thrash” in the system. These products are better placed in a flow-rack channel or a pick location where I can replenish multiple cases at once.

This leads us to the second point – storage. Yes, you could have multiple totes of the same product in the P2P technology, but the cost of the multiple locations in this technology argues against it. Again, a simpler storage location where more of the same product is stored might be more effective.

Coffee cups would work well in a flow rack location, where pencils would be ideal in the P2P system. In selecting SKUs for the P2P technology, then, the product velocity AND cubic velocity must be considered.

Later we will focus on what to do with all that remains – the leftovers. I would be interested to hear some examples of how your company concentrated your slow-movers and dealt with the Museum Pieces.  Do you have a clever use of technology to solve this problem? Let us know by commenting below!

Share this:

  • Email
  • Print
  • Tweet

Like this:

Like Loading...
Filed Under: Pareto Principle Tagged With: 80-20 Rule

An Efficient Distribution Center from Pulling the Weeds

by Cory Flemings

In my last post, I talked about the Pareto Principle, or the 80-20 Rule, and of falling into the trap of a single-technology system for the entire SKU base. In this installment, I want to talk about the fast-moving SKUs and how dealing with them can make your distribution center more efficient.

The fastest-moving SKUs in the distribution center are the top 20% of the SKU base. These SKUs generate, around 80% of your volume.pull the weeds in your distribution center

Now, the ratio of 80-20 is not always exact; nor is it proportional to 100%. For example, some companies have an 80-30 relationship meaning that 80% of their volume is generated by 30% of their SKUs.

That’s OK.

It just means that the slope of the curve for your operation is not quite as steep as Mr. Pareto would suggest. What is important is that you identify the group of SKUs that do generate 80% of your volume, and focus on these. These make you money!

The principle of efficiency is to concentrate the fast-moving, frequently-touched SKUs in single area. “Pull the weeds” – eliminate all other slower–moving SKUs, so you can efficiently service the 20% of your product base that generates 80% of your volume. By pulling the weeds, you can make even more money because you will generate business with less effort.

Now, the top 20% really has two sub-sets: the top 2% (AA-movers), and the next 18% (A-movers).

The top 2% have wings. They practically fly out of the distribution center by themselves. If you run a distribution center, you know right now which these products are in your gut. Your employees all talk about them.

Remember when the iPod Nano® came out? The cartons practically came with retro rockets to move them faster through the supply chain. Distribution centers couldn’t keep them in stock.

And that’s the problem with these SKUs; replenishment. The most difficult part of managing these SKUs is not picking them – you can do that with snow shovels. The difficulty is keeping up with the replenishment tasks.

When you think about technologies for the top 2%, think in terms of replenishment. How do I replenish the pick location with as little movement as possible?

Specific technologies will vary, of course, upon the SKU or carton size. The principle is to replenish the largest unit practicable. In full-case picking, the replenishment unit is always a unit-load, or pallet.

When the Nano came out, we were suggesting this product be replenished by the pallet-load as well. The picking was done by a pick-to-light display over a set of pallet locations for the AA movers. Think about it; if you were to replenish those Nanos at the case-level, how many man-hours per day would you spend replenishing the pick slot? You would be back every 15 minutes with more cases. For the AA-movers, tackle the replenishment tasks first.

The next 15% — the A movers — require that you “pull the weeds.”

Think about how many products your selectors have to walk past to get to the products they need to fill an order. If 80% of your volume is done by the top 20%, it stands to reason that you need to get the other SKUs out of the way.

Now that you have this 18% concentrated in one area, what can you do?

Technologies to consider:

Automated picking systems (A-frames) – these systems automatically pick the order for you. They can generate as much as 2,400 32-piece orders per hour! The drawback of A-frames is that they are form-factor specific; they require small, lightweight cuboid-shaped or stackable products.

They are ideal for pharmaceuticals, cosmetics and office supplies. They are off the table for apparel, poly-bagged items or irregular shapes. There are automated machines for all three bandwidths of the Pareto curve, so if you have these types of products, they are something to consider.

Mini-load-replenished put-to-light or batch-picking systems – most people are well-familiar with pick-to-light technology. The following application may also be done with pick-to-voice. The new twist here is to glue the pick-to-light locations onto the side (the long, down-aisle side) of a mini-load. What you have now is an automatically-replenished pick-to-light location.

What is so special about this?

You get the picking efficiency of pick-to-light (250 lines/hr +) and no people required for replenishment. All of the replenishment stock is in the air above your head (nobody can get to it to cause shrinkage or inventory changes), and the control system tells the mini-load crane when to bring down more stock. But wait! That’s not all! You can also use the crane to swap out SKUs no longer needed during the picking shift to condense your pick zone even further. (Be careful – this must be carefully engineered – do not try this at home!)

Pick-to-light with zone-bypass conveyor systems – This technique embeds the conveyor system into the flow-rack and consists of two conveyors: a transport conveyor (the highway), and the picking spur. The transport conveyor is closer to the back of the rack, and the picking spur is on the pick-aisle. This arrangement allows the conveyor system to bypass pick zones the order tote does not need to visit, and only visit the ones it needs.

This is, of course, not an exhaustive list, but merely some examples to get the juices flowing. I would be interested to hear some examples of how your company concentrated your A-movers and pulled the weeds. Have a clever use of technology to solve this problem? Let us know!  Learn more about new ideas in distribution; Download abco AUTOMATION’s whitepaper!

Share this:

  • Email
  • Print
  • Tweet

Like this:

Like Loading...
Filed Under: Pareto Principle, Uncategorized Tagged With: 80-20 Rule, pareto, slow movers

Expanding the Pareto Principle in Distribution

by SethWeisberg

Only 20% of the SKUs in your distribution center make up 80% of your volume.

This point, to most people in distribution, is not a big surprise.  Most people already know the 80-20 rule, or at least have heard of it.  What is a surprise to most people in distribPareto Principle and Distributionution is that they are missing huge opportunities in efficiency by not applying the rule.  As a systems integrator I see different distribution centers every week.  No matter what industry I go to – from apparel to auto parts – everybody does distribution the same basic way.  Oh, there are nuances, of course, but by and large, they use the same application of technology for their entire operation.  They ignore the Pareto Principle.

Let me explain.

Italian economist Vilfredo Pareto observed in 1906 that 80% of the land in Italy was owned by only 20% of the population.  Later, business-management thinker, Joseph M. Juran, further developed the 80-20 rule and named it after Pareto by observing that 20% of the pea pods in his garden contained 80% of the peas.

In the distribution center, like the garden, the same principal holds true (in general).

Balance is not always good.  Leveraging the natural imbalance of product movement is an opportunity to drive tremendous benefits to you and your company.  Single-technology distribution systems assume that all products should be handled the same way.  Think about it – if you have a static pick slot for every SKU in your distribution center, and you have a person walk to every location, you have a single-technology system. Single-technology systems make the assumption in the chart on the right.Concepting from abco automation

Mr. Pareto would suggest that we should apply different technologies on the 20% of the SKUs that generate 80% of your business than we do on the 80% of the SKUs that only generate 20% of your business.  In other words, we need to apply multiple technologies to optimize the efficiency in different “bandwidths” of the Pareto Curve of your SKU base.

Get this principle right and you are well on the way of creating a world-class distribution operation.

In subsequent posts, I will talk about what technologies apply to different parts of the Pareto curve, and why.  Stay tuned!

Want to learn more about leveraging the Pareto Principle in your distribution center? Contact abco automation for a consultation.

Share this:

  • Email
  • Print
  • Tweet

Like this:

Like Loading...
Filed Under: Math, Pareto Principle, Uncategorized Tagged With: 80-20 Rule, distribution, distribution center principles, Pareto principle

Subscribe to Our Blog

Enter your email address to subscribe to this blog and receive notifications of new posts by email.

Copyright abco AUTOMATION 2023

Return to top of page

Copyright © 2025 on Genesis Framework · WordPress · Log in

%d